
What is a rainbow pattern?
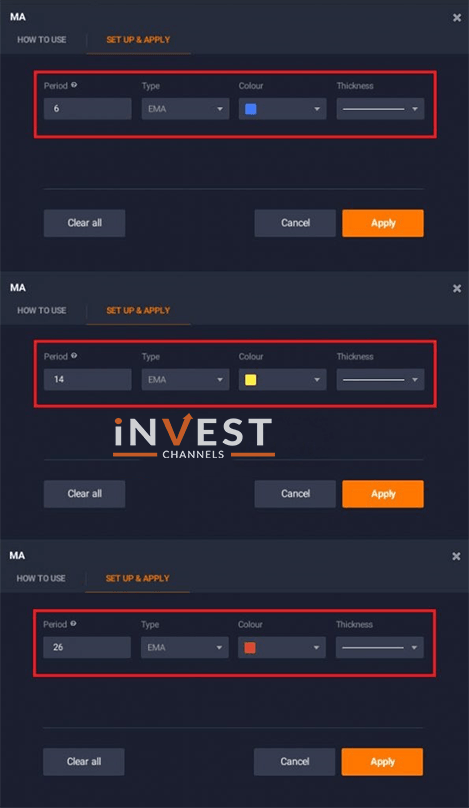
This graphical pattern includes use of three exponential moving averages with different periods. First with the period of six of blue color, second with the period of 14 of yellow color and third with the period of 26 of red color.
Trading signals based on rainbow pattern
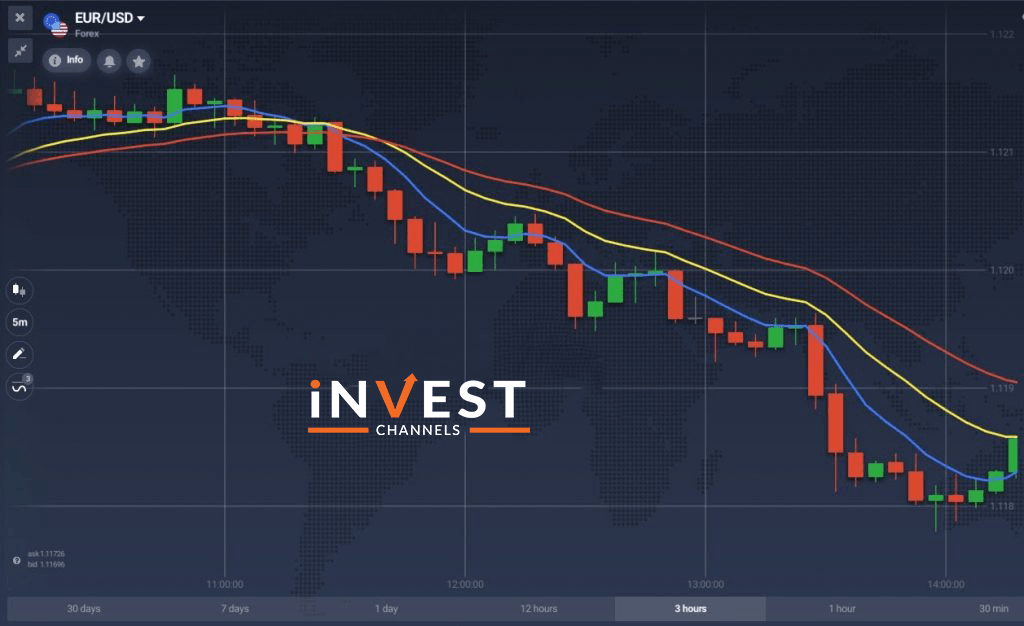
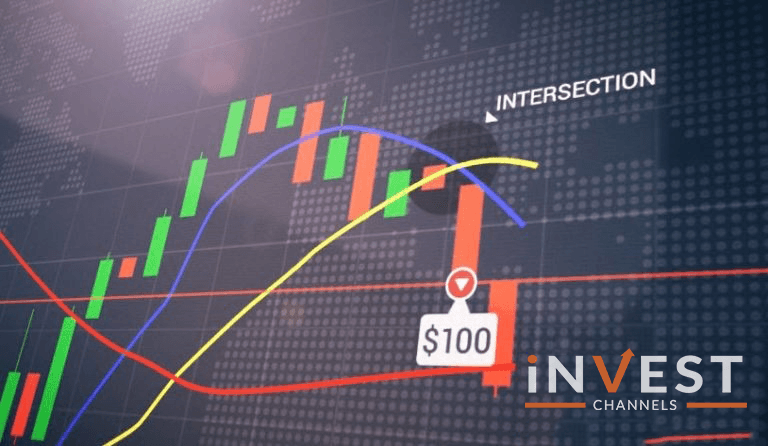
Many participants believe that there exist the following powerful signals of asset price decline. Blue line with the period of six is above all others. Yellow line with a period of 14 is under the blue line.
Red line with a period of 26 is below all others. The intersection of the blue line with the period of six and the yellow line with the period of 14 is for most traders the point of access onto the market and purchasing the option.
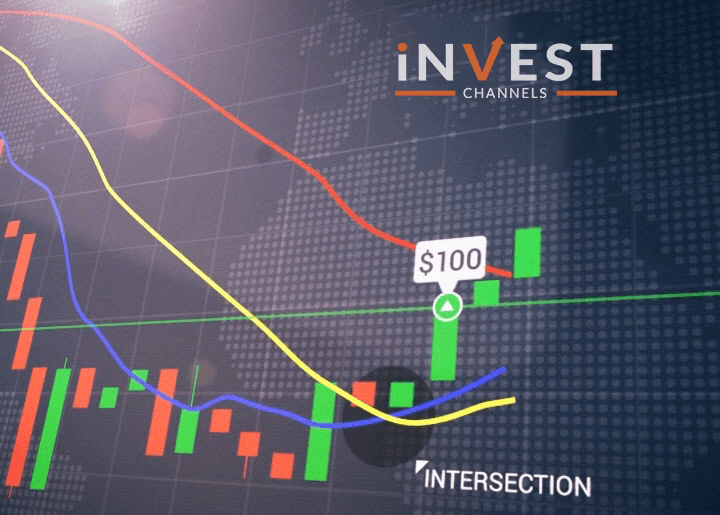
The probability of price increase is higher, if blue line with a period of six is below all others, yellow line with the period of 14 is above the blue line. Red line with the period of twenty six is above all others.
The intersection of the blue line with a period of six and the yellow line with a period of 14 is for most traders. The point of access onto the market and of purchasing the option.
We also encourage you to check our article about SMA strategy.
We wish you successful trading with IQ option.
You might also want to read


Top 5 Trending

In the world of online trading — often filled with risk and uncertainty — verifying the credibility of a platform… [Read More]

Starting your trading journey can feel overwhelming — there are countless assets to choose from, and it’s hard to know… [Read More]

"Why do I keep losing money in trading?" This is a question every trader has asked at some point. Experiencing… [Read More]

Trading indices is more than just a financial pursuit; it's both an art and science, demanding attention to detail, a… [Read More]
Forget Tiffany’s—there’s a diamond that traders treasure even more. Diamond chart patterns may not sit on a ring, but they… [Read More]