
How does RSI work?
The RSI indicator used in technical analysis defines the strength of tren and probability of trend reversal. Also, it is used to evaluate overbought or oversold conditions in the price of the stock.
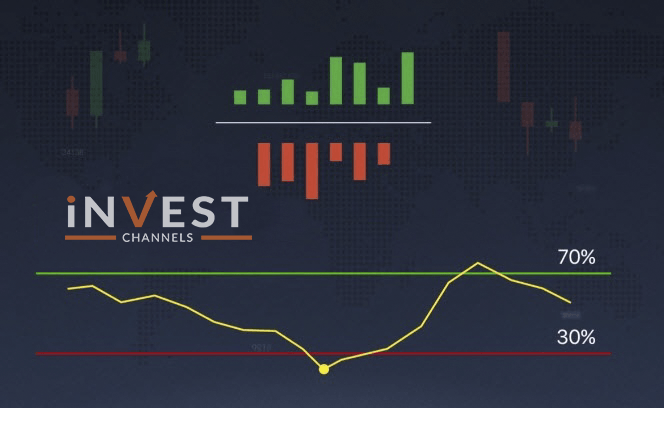
The indicator shows the data on zero per cent to hundred per cent. Thus if all the candlesticks are green it signifies a hundred per cent and if at the end of the day all the candlesticks are red it signifies zero per cent.
Period and overbought/oversold areas
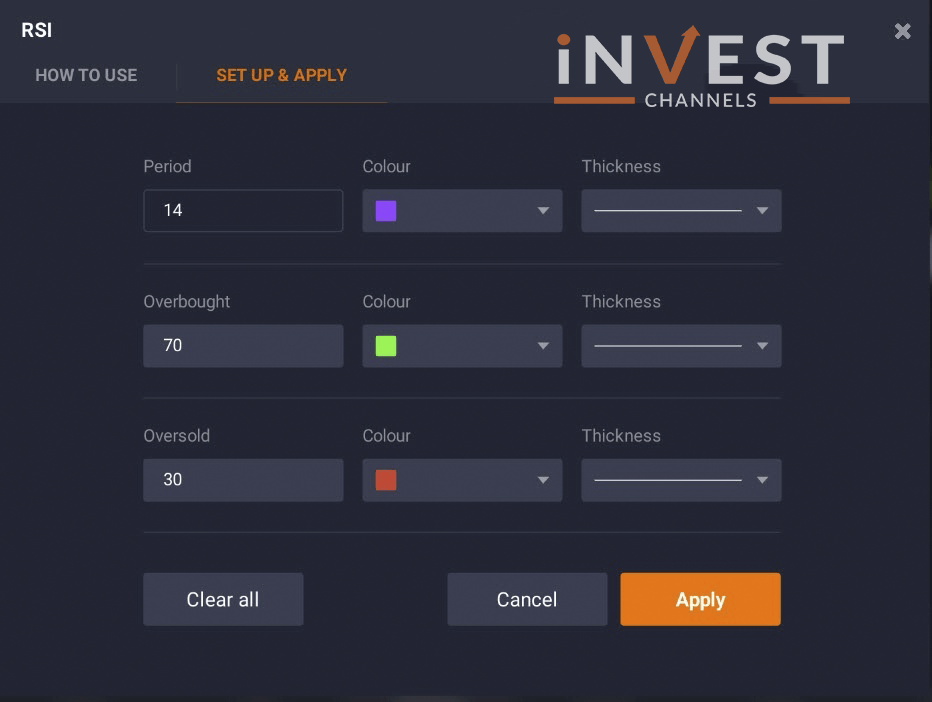
A period is nothing but a candlestick quantity that is used for data collecting. It is always set on 14 by default in the indicator settings.
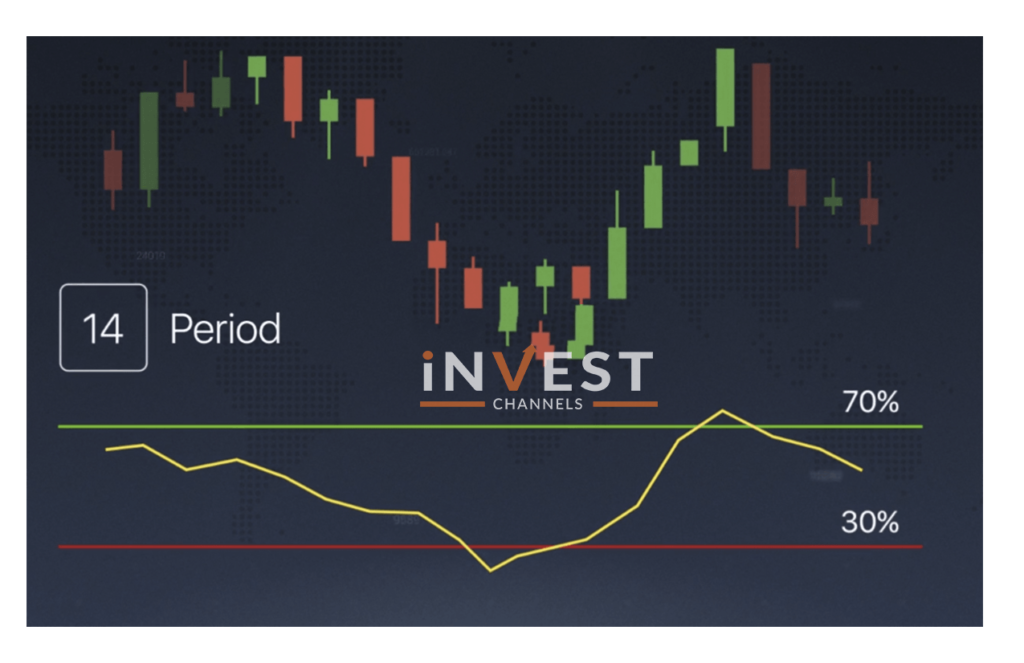
There are also overbought and oversold values which are set to 70 per cent and 30 per cent by default respectively. If overbought values get closer to 100 per cent and oversold value to 0 per cent then it is more precise signals.
Using Relative Strength Index
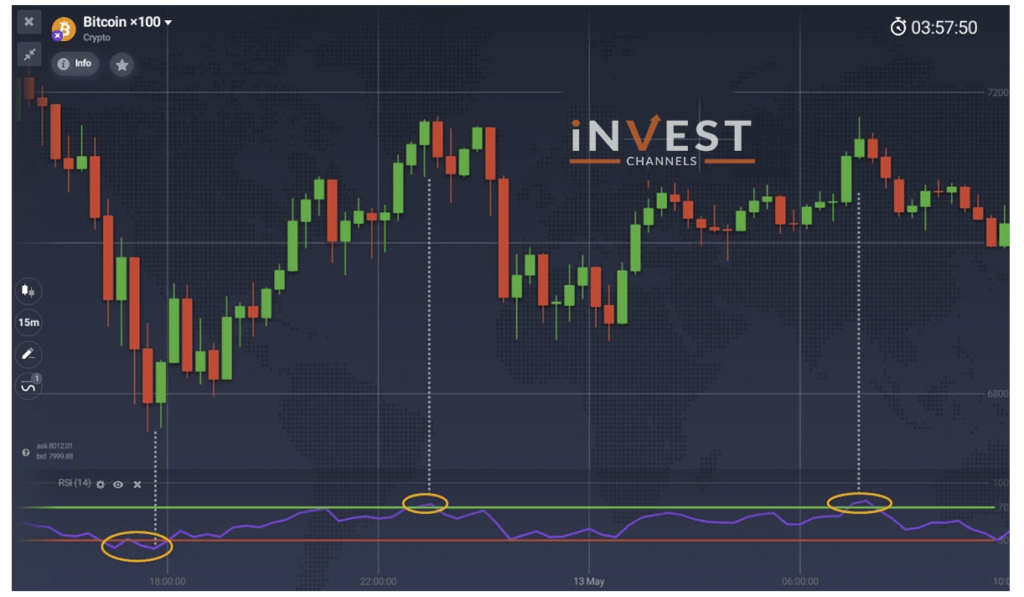
You can determine an overbought case when an RSI indicator intersects on a higher level and an oversold case occur when the indicator intersects on a lower border where prices are expected to get too low or too fast.
We urge you to read about divergences on RSI as it is an interesting way to Relative Strength Index(RSI) on the IQ Option platform.
We wish you successful trading!
You might also want to read


Top 5 Trending

In the world of online trading — often filled with risk and uncertainty — verifying the credibility of a platform… [Read More]

Starting your trading journey can feel overwhelming — there are countless assets to choose from, and it’s hard to know… [Read More]

"Why do I keep losing money in trading?" This is a question every trader has asked at some point. Experiencing… [Read More]

Trading indices is more than just a financial pursuit; it's both an art and science, demanding attention to detail, a… [Read More]

Forget Tiffany’s—there’s a diamond that traders treasure even more. Diamond chart patterns may not sit on a ring, but they… [Read More]